Real Estate Trends – Interested in Your Neighborhood?
(Information via Keller Williams)

 According to the National Association of REALTORS®, existing home sales accelerated significantly in November, reaching their fastest rate of growth in over 10 years. In spite of ongoing inventory constraints, particularly in the starter-home segment, and a healthy, growing median home price, homes are selling rapidly as buyers scoop up available properties.
Interest Rates
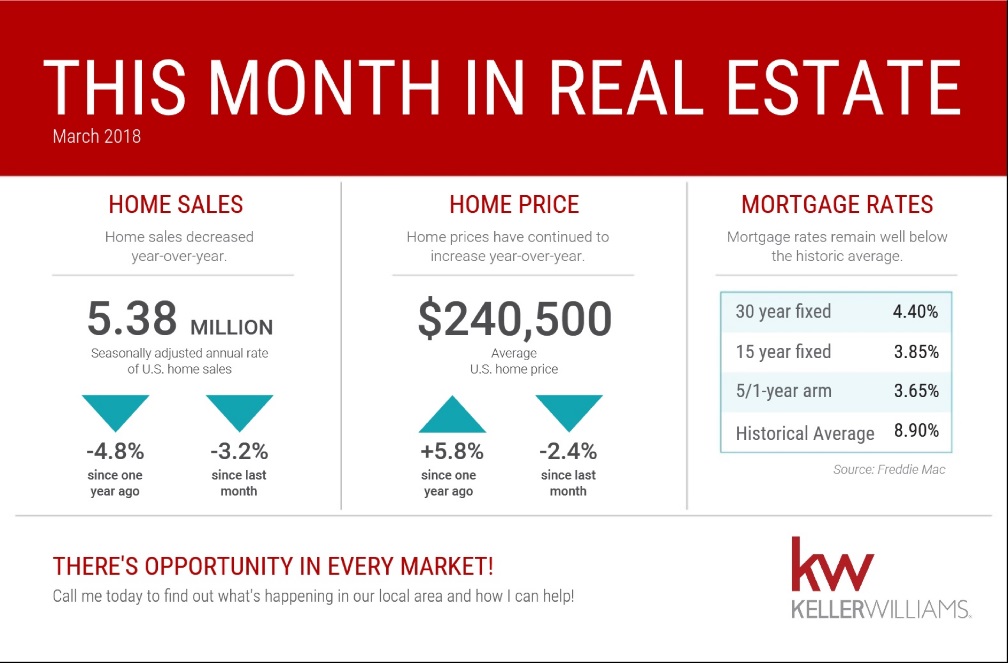
According to Freddie Mac, 30-year fixed rates rose from 3.90 percent to 3.99 percent. This rate remains well below the historical average of 8.90 percent.
Home Sales
The National Association of REALTORS® reported home sales at a seasonally adjusted annual rate of approximately 5.8 million homes during the month of November. This was an increase of 5.6 percent from October and an increase of 3.8 percent from November of last year.

Home Prices

The median home price increased to $248,000 in November, which was up 0.8 percent from October and up 5.8 percent from November of last year. The median home price has increased by approximately $13,600 in the past year alone.
Inventory
There was a 3.4-month supply of housing inventory in November, which was a 12.8 percent decrease from October. The total number of available homes for sale has decreased by 15.0 percent compared to November of last year.

Interested in what’s happening in the greater Athens area or your neighborhood? Submit a request for contact or give us a call for a no obligation review!
Brought to you by KW Research. For additional graphs and details, please see the This Month in Real Estate PowerPoint Report.The opinions expressed in This Month in Real Estate are intended to supplement opinions on real estate expressed by local and national media, local real estate agents and other expert sources. You should not treat any opinion expressed on This Month in Real Estate as a specific inducement to make a particular investment or follow a particular strategy, but only as an expression of opinion. Keller Williams Realty, Inc., does not guarantee and is not responsible for the accuracy or completeness of information, and provides said information without warranties of any kind. All information presented herein is intended and should be used for educational purposes only. Nothing herein should be construed as investment advice. You should always conduct your own research and due diligence and obtain professional advice before making any investment decision. All investments involve some degree of risk. Keller Williams Realty, Inc., will not be liable for any loss or damage caused by your reliance on information contained in This Month in Real Estate.


 The National Association of REALTORS® reported home sales at a seasonally adjusted annual rate of approximately 5.5 million homes during the month of October. This was an increase of 2.0 percent from September and a decrease of 0.9 percent from October of last year.
 The median home price decreased to $247,000 in October, which was down 0.2 percent from September and up 5.5 percent from October of last year. The median home price has increased by approximately $12,900 in the past year alone.
 There was a 3.9-month supply of housing inventory in October, which was a 7.1 percent decrease from September. The total number of available homes for sale has decreased by 11.4 percent compared to October of last year.